
Table of Contents
Relative Strength Index (RSI)
What Is the Relative Strength Index (RSI)?
The relative strength index (RSI) is a momentum indicator used in technical analysis that measures the magnitude of recent price changes to evaluate overbought or oversold conditions in the price of a stock or other asset. The RSI is displayed as an oscillator (a line graph that moves between two extremes) and can have a reading from 0 to 100. The indicator was originally developed by J. Welles Wilder Jr. and introduced in his seminal 1978 book, “New Concepts in Technical Trading Systems.”
Traditional interpretation and usage of the RSI are that values of 70 or above indicate that a security is becoming overbought or overvalued and may be primed for a trend reversal or corrective pullback in price.
And an RSI reading of 30 or below indicates an oversold or undervalued condition.
The relative strength index (RSI) is a popular momentum oscillator developed in 1978.
The RSI provides technical traders signals about bullish and bearish price momentum, and it is often plotted beneath the graph of an asset’s price.
An asset is usually considered overbought when the RSI is above 70% and oversold when it is below 30%.
The Formula for RSI
The relative strength index (RSI) is computed with a two-part calculation that starts with the following formula:
                  100
    RSI = 100 - --------
                 1 + RS

    RS = Average Gain / Average Loss
The average gain or loss used in the calculation is the average percentage gain or loss during a look-back period. The formula uses a positive value for the average loss.
The standard is to use 14 periods to calculate the initial RSI value.
The very first calculations for average gain and average loss are simple 14-period averages:
-
First Average Gain = Sum of Gains over the past 14 periods / 14.
-
First Average Loss = Sum of Losses over the past 14 periods / 14
The second, and subsequent, calculations are based on the prior averages and the current gain loss:
-
Average Gain = [(previous Average Gain) x 13 + current Gain] / 14.
-
Average Loss = [(previous Average Loss) x 13 + current Loss] / 14.
Once there are 14 periods of data available, the second part of the RSI formula can be calculated. The second step of the calculation smooths the results.
Calculation of the RSI
Using the formulas above, RSI can be calculated, where the RSI line can then be plotted beneath an asset’s price chart.
The RSI will rise as the number and size of positive closes increase, and it will fall as the number and size of losses increase. The second part of the calculation smooths the result, so the RSI will only near 100 or 0 in a strongly trending market.
In TradingView, RSI indicator is in built technical indicator which can be added to chart. Use a Free account for signing up and all indicators are still available. For beginners this will be the best to start with.
HINDALCO rsi indicator showing oscillator with 70 and 30 levels of overbought and oversold regions.
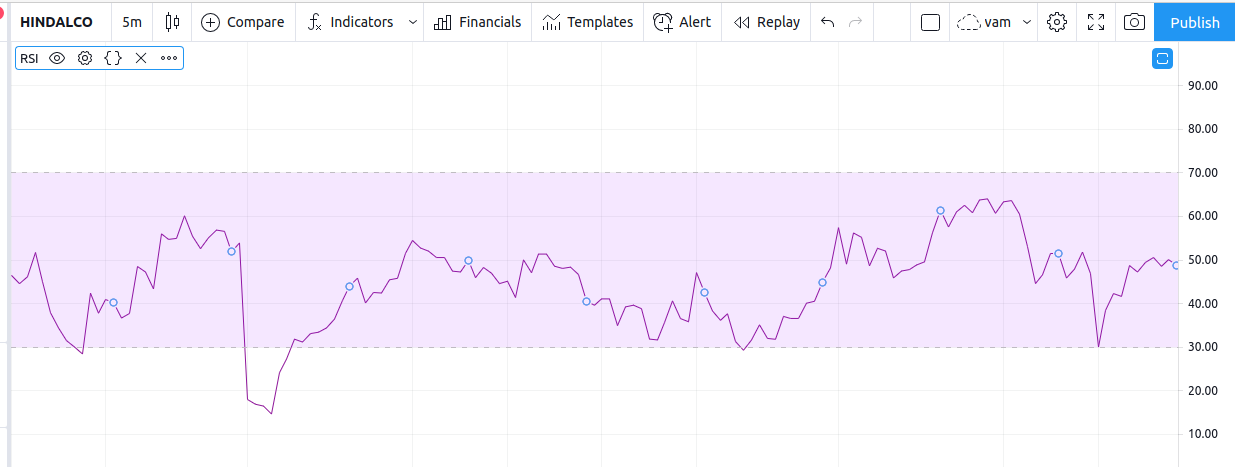
As you can see in the above chart, the RSI indicator can stay in the overbought region for extended periods while the stock is in an uptrend. The indicator may also remain in oversold territory for a long time when the stock is in a downtrend. This can be confusing for new analysts, but learning to use the indicator within the context of the prevailing trend will clarify these issues.
What Does RSI Tell You?
The primary trend of the stock or asset is an important tool in making sure the indicator’s readings are properly understood.
Interpretation of RSI and RSI Ranges
Generally, when the RSI surpasses the horizontal 30 reference level, it is a bullish sign and when it slides below the horizontal 70 reference level, it is a bearish sign. Put another way, one can intepret RSI values of 70 or above indicate a security is becoming overbought or overvalued and may be primed for a trend reversal or corrective price pullback. An RSI reading of 30 or below indicates an oversold or undervalued condition.
During trends, the RSI readings may fall into a band or range. During an uptrend, the RSI tends to stay above 30 and should frequently hit 70. During a downtrend, it is rare to see the RSI exceed 70, and the indicator frequently hits 30 or under. These guidelines can help determine trend strength and spot potential reversals.
For example, if the RSI isn’t able to reach 70 on a number of consecutive price swings during an uptrend, but then drops below 30, the trend has weakened and could be reversing lower.
The opposite is true for a downtrend. If the downtrend is unable to reach 30 or below and then rallies above 70, that downtrend has weakened and could be reversing to the upside. Trendlines and moving averages are helpful tools to include when using the RSI in this way.
Example of RSI Divergences
A bullish divergence occurs when the RSI creates an oversold reading followed by a higher low that matches correspondingly lower lows in the price. This indicates rising bullish momentum, and a break above oversold territory could be used to trigger a new long position.
Few divergences spotted below for bearish divergence and hidden bullish divergences. It is swings in prices vs swings in RSI Oscillators.
HINDALCO chart below showing some divergences
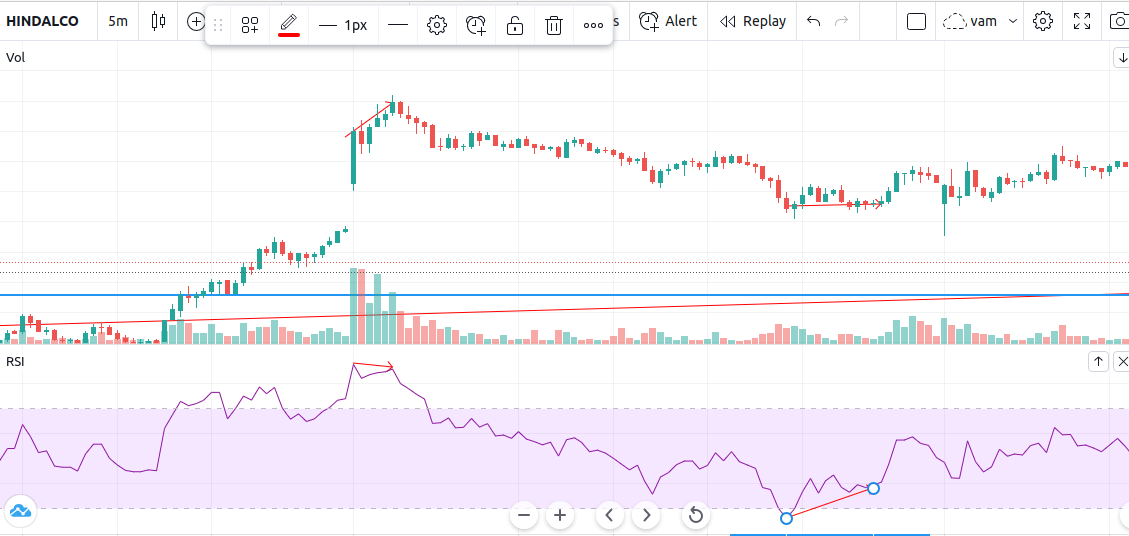
A bearish divergence occurs when the RSI creates an overbought reading followed by a lower high that matches corresponding higher highs on the price.
As you can see in the following chart, a bullish divergence was identified when the RSI formed higher lows as the price formed lower lows. This was a valid signal, but divergences can be rare when a stock is in a stable long-term trend. Using flexible oversold or overbought readings will help identify more potential signals.
Example of RSI Swing Rejections
Another trading technique examines the RSI’s behaviour when it is reemerging from overbought or oversold territory. This signal is called a bullish “swing rejection” and has four parts:
RSI falls into oversold territory.
RSI crosses back above 30%.
RSI forms another dip without crossing back into oversold territory.
RSI then breaks its most recent high.
As you can see in the following chart, the RSI indicator was oversold, broke up through 30% and formed the rejection low that triggered the signal when it bounced higher. Using the RSI in this way is very similar to drawing trendlines on a price chart.
Like divergences, there is a bearish version of the swing rejection signal that looks like a mirror image of the bullish version. A bearish swing rejection also has four parts:
RSI rises into overbought territory.
RSI crosses back below 70%.
RSI forms another high without crossing back into overbought territory.
RSI then breaks its most recent low.
The following chart illustrates the bearish swing rejection signal. As with most trading techniques, this signal will be most reliable when it conforms to the prevailing long-term trend. Bearish signals during downward trends are less likely to generate false alarms.
Limitations of the RSI Explained
The RSI compares bullish and bearish price momentum and displays the results in an oscillator that can be placed beneath a price chart. Like most technical indicators, its signals are most reliable when they conform to the long-term trend.
True reversal signals are rare and can be difficult to separate from false alarms. A false positive, for example, would be a bullish crossover followed by a sudden decline in a stock. A false negative would be a situation where there is a bearish crossover, yet the stock accelerated suddenly upward.
Since the indicator displays momentum, it can stay overbought or oversold for a long time when an asset has significant momentum in either direction. Therefore, the RSI is most useful in an oscillating market where the asset price is alternating between bullish and bearish movements.
Bullet points covered here:
- rsi indicator buy and sell signals
- rsi indicator settings
- rsi full form
- secret of rsi indicator
- rsi indicator app
- how to use rsi indicator
- download rsi indicator
- webull rsi indicator or tradingview rsi indicator