
Table of Contents
Support and Resistance Basics – Importance of Support and Resistance in Trading Stocks, Indices
What we Cover here are
- Support and Resistance Defined
- The Basics on how they are calculated
- Trendlines
- Moving Averages
- Other Indicators
Significance of Support and Resistance Zones
The concepts of trading level support and resistance are undoubtedly two of the most highly discussed attributes of technical analysis. Part of analysing chart patterns, these terms are used by traders to refer to price levels on charts that tend to act as barriers, preventing the price of an asset from getting pushed in a certain direction.
Technical analysts use support and resistance levels to identify price points on a chart where the probabilities favour a pause or reversal of a prevailing trend.
Definition of Support and Resistance:
Support occurs where a downtrend is expected to pause due to a concentration of demand.Support is a price level where a downtrend can be expected to pause due to a concentration of demand or buying interest. As the price of assets or securities drops, demand for the shares increases, thus forming the support line.
Resistance occurs where an uptrend is expected to pause temporarily, due to a concentration of supply. resistance zones arise due to selling interest when prices have increased.
Market psychology plays a major role as traders and investors remember the past and react to changing conditions to anticipate future market movement.
Support and resistance areas can be identified on charts using trend lines and moving averages.
Once an area or “zone” of support or resistance has been identified, those price levels can serve as potential entry or exit points because, as a price reaches a point of support or resistance, it will do one of two things—bounce back away from the support or resistance level, or goes through the price level and continue in its direction—until it hits the next support or resistance level.
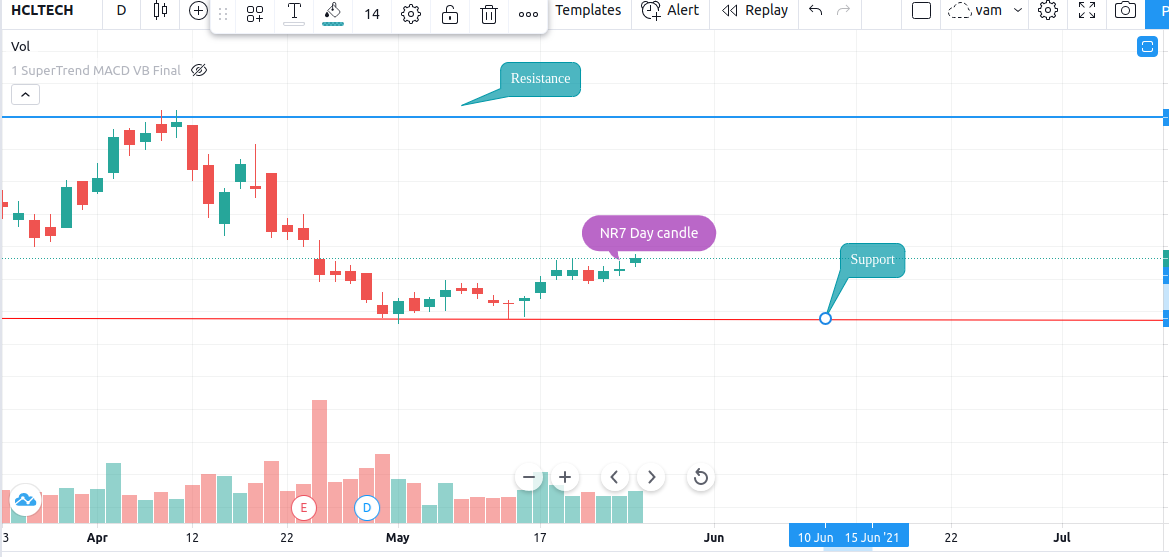
HCLTech Daily chart with Support and Resistance:
The timing of some trades is based on the belief that support and resistance zones will not be broken. Whether the price is halted by the support or resistance level, or it breaks through, traders can “bet” on the direction and can quickly determine if they are correct. If the price moves in the wrong direction, the position can be closed at a small loss. If the price moves in the right direction, however, the move profit may be substantial.
This static barrier is one of the most popular forms of support/resistance, but the price of financial assets generally trends upward or downward, so it is not uncommon to see these price barriers change over time. This is why the concepts of trending and trend lines are important which leads to about support and resistance zones.
When the market is trending to the upside, resistance levels are formed as the price action slows and starts to move back toward the trendline. This occurs as a result of profit taking/booking or near-term uncertainty for a particular issue or sector. The resulting price action undergoes a Stop/reversal effect in stock price.
Traders pay close attention to the price of a security as it falls toward the broader support of the trend line.
This will have been an area that has prevented the price of the asset from moving substantially lower in historical charts.
The support/resistance of an identified level, whether discovered with a trend line or through any other method, is deemed to be stronger the more times that the price has historically been unable to move beyond it. Many technical traders will use their identified support and resistance levels to choose strategic entry/exit points because these areas often represent the prices that are the most influential to an stocks price direction. Most traders are confident at these levels in the underlying value of the stock, so the volume generally increases more than usual, making it much more difficult for traders to continue driving the price higher or lower.
Moving Averages to confirm the trend for checking strength of the momentum:
Most technical traders incorporate the power of various technical indicators, such as moving averages, to aid in predicting future short-term momentum, but these traders never fully realise the ability these tools have for identifying levels of support and resistance. As you can see from the chart below, a moving average is a constantly changing line that smooths out past price data while also allowing the trader to identify support and resistance. Notice how the price of the asset finds support at the moving average when the trend is up, and how it acts as resistance when the trend is down.
Traders can use moving averages in a variety of ways, such as to anticipate moves to the upside when price lines cross above a key moving average, or to exit trades when the price drops below a moving average. Regardless of how the moving average is used, it often creates “automatic” support and resistance levels.
The “golden ratio” used in the Fibonacci sequence to find support and resistance on stocks and also observed repeatedly in nature and social structure.
The Fibonacci retracement tool is a favourite among many short-term traders because it clearly identifies levels of potential support/resistance levels for dynamic levels of support and resistance.
Number of Touches
The more times the price tests a support or resistance area, the more significant the level becomes. When prices keep bouncing off a support or resistance level, more buyers and sellers notice and will base trading decisions on these levels.
Momentum of Price Move is important
Support and resistance zones are likely to be more significant when they are preceded by steep advances or declines showing momentum of stocks. A fast and steep advance or uptrend will be met with more competition and enthusiasm and may be halted by a more significant resistance level than a slow, steady advance. A slow advance may not attract as much attention.
Volume at Certain Price Levels
The more buying and selling that has occurred at a particular price level, the stronger the support or resistance level is likely to be. This is because traders and investors remember these price levels and are apt to use them again. When strong activity occurs on high volume and the price drops, a lot of selling will likely occur when price returns to that level, since people are far more comfortable closing out a trade at the breakeven point rather than at a loss.
Bullet points:
- Support and resistance levels are one of the key concepts used by technical analysts and form the basis of a wide variety of technical analysis tools.
- The basics of support and resistance consist of a support level, which can be thought of as the floor under trading prices and a resistance level, which can be thought of as the ceiling.
- Prices fall and test the support level, which will either “hold,” and the price will bounce back up, or the support level will be breached and the price will drop through the support and likely continue lower to the next support level.
- Determining future levels of support can drastically improve the returns of a short-term investing strategy because it gives traders an accurate picture of what price levels should prop up the price of a given security in the event of a correction.
- Also likewise determining a level of resistance can be advantageous because this is a price level that could potentially harm a long position, signifying an area where investors have a high willingness to sell the security.
There are several different methods to choose when looking to identify support/resistance but they remains the same that is to prevents the price of an underlying stock from moving in a certain direction.
Brief Notes:
- support and resistance trading strategy pdf – a pdf will be shortly uploaded
- how to find support and resistance levels – by using technical charts finding higher highs, lower lowers and vice versa and connecting them.
- how to calculate support and resistance levels for stocks – Above formula’s can be used for calculating the supports, resistances.
- stock support and resistance website – this website will have uploaded various trading techniques by also specifying Support and Resistance.
- how to find support and resistance in day trading – You can use various indicators which calculate support and resistance in day trading.
- support and resistance indicator – indicators are used to plot Support and resistance on the charts.
- how to draw support and resistance lines for intraday -by using technical charts finding higher highs, lower lowers and vice versa and connecting them together manually or use of indicators.